PetalTrace: AI Agent Observability and Replay
docs.petallabs.io · checked 4 Oct 2026
Open-source observability for inspecting AI agent runs, prompts, tools, costs, and timelines.
How it plugs in
Signal on AI Agent Observability Tools6.7#12 of 31
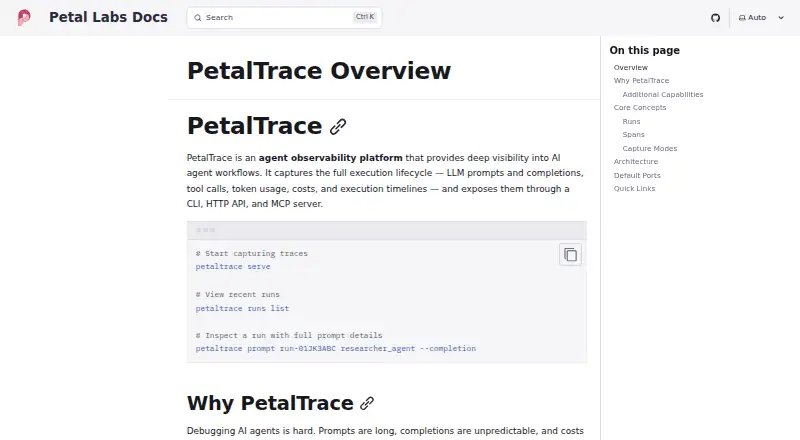
PetalTrace is a free, open-source platform for examining AI agent workflows. It records prompts, responses, tool calls, token use, costs, and execution timelines. A web interface, command-line tool, HTTP API, and MCP server support investigation and replay. It can run locally or be self-hosted, with SQLite storing trace data.
Review
In a line
PetalTrace is an observability platform for inspecting how AI agents run and how their workflows behave.
It records the steps, prompts, tool activity, usage, costs, and timing of those runs.
What it does
PetalTrace captures system prompts, message history, tool definitions, model responses, tool calls, token counts, costs, and execution timelines. Full-text search covers prompts and completions, while live runs can appear through real-time feeds.
You can compare two runs for prompt, output, and cost changes. Captured runs can be replayed with another model or temperature, or in mocked mode. PetalFlow adds graph structure, node inputs and outputs, and replay-ready snapshots.
How it connects
The product provides a command-line interface, HTTP API, MCP server, and React web interface. Its MCP server lets agents search trace history, inspect prompts, review costs, compare runs, and start replays; the documentation includes Claude Code setup.
PetalTrace accepts standard OpenTelemetry traces from instrumented applications, including apps that do not use PetalFlow. PetalFlow capture can be minimal, standard, or full, adding progressively more prompt, tool, graph, and edge information.
The public repository is MIT-licensed. The documented store uses SQLite and full-text search, with a default database at ~/.petaltrace/data.db.
Good fit
PetalTrace suits developers working with AI agent workflows who need to inspect runs, investigate prompt or tool behavior, compare outcomes, and track spending by workflow, provider, or model.
It supports API, Linux, macOS, Windows, web, and self-hosted use. The repository describes a local daemon that can be built from source or run from a release binary.
Watch for
Authentication is marked as future functionality and is disabled by default in the configuration reference. Check this before exposing a deployment beyond a trusted environment.
The documented defaults retain normal runs for 30 days and failed runs for 90 days, with a maximum retention period of 365 days. Installation from source requires Go, although release binaries are also linked.
The facts do not state commercial plans, usage limits, or hosted service terms.
Pricing
PetalTrace is free and open source. A free plan is listed, and the public repository states no commercial pricing or usage limits.
Verdict
Choose PetalTrace if you want self-hosted inspection of AI agent traces, prompt and tool details, cost analysis, run comparison, and replay through open interfaces.
Look elsewhere if you need built-in authentication today, a stated hosted-service plan, or documented commercial support and limits.
Our take
PetalTrace is a sensible match for teams that want to keep agent traces locally or run their own service. Its combination of prompt capture, tool tracing, cost breakdowns, comparisons, replay, OpenTelemetry input, and MCP access covers both debugging and ongoing review. The free MIT-licensed repository lowers the entry cost. Buyers should plan around the current authentication gap, retention settings, and source-based installation path, and should not assume a hosted offering or usage limits that are not documented here.
- Free and open-source under the MIT license
- Captures prompts, completions, tools, tokens, costs, and timelines
- Compares runs and supports replay with different settings
- CLI, HTTP API, MCP server, and web interface
- Accepts OpenTelemetry traces from other applications
- Authentication is future functionality and disabled by default
- Default retention is 30 days for runs and 90 for failed runs
- No commercial pricing or usage limits are documented
- Pick it ifDevelopers debugging and reviewing AI agent workflows; Teams wanting self-hosted trace storage and replay; Projects using OpenTelemetry or MCP
- Skip it ifYou need built-in authentication now; You require a documented hosted plan or commercial support; You want installation without source builds or release binaries
Pricing
PetalTrace costs nothing and is open source. The public repository lists no commercial pricing or usage limits, so buyers should confirm deployment and operating costs themselves.
- PetalTracePublic repository; no commercial pricing or usage limits statedFree
As github.com lists them, checked 4 Oct 2026.
Questions
Is PetalTrace free?
Yes. PetalTrace is listed as free and open source, with an MIT-licensed public repository. No commercial pricing or usage limits are stated.
What does PetalTrace record?
It records prompts, message history, tool definitions, model responses, tool calls, token usage, costs, and execution timelines.
Can PetalTrace replay an AI run?
Yes. Captured runs can be re-executed with different models or temperatures, or in mocked mode. PetalFlow also adds replay-capable snapshots.
How can I access PetalTrace?
It offers a command-line tool, HTTP API, MCP server, and React web interface. The MCP documentation includes Claude Code configuration.
Does it work with applications outside PetalFlow?
Yes. PetalTrace accepts standard OpenTelemetry traces from any instrumented application, including applications that do not use PetalFlow.
Where are traces stored?
The documented architecture stores runs, spans, and language-model interactions in SQLite. The default database path is ~/.petaltrace/data.db.
Is authentication included?
The configuration reference labels authentication as future functionality and shows it disabled by default.
How long are runs kept?
Defaults retain runs for 30 days and failed runs for 90 days. The maximum retention period is 365 days.