Crashes, No Sound, or Screen Glitches?
Random freezes, missing sound and display glitches usually trace back to one bad driver. Find and replace yours safely.Free scan · under a minuteWindows Errors? Fix Them Before They Spread
Repair common Windows errors and clear accumulated junk for a smoother, more stable PC - no reinstall needed.Free scan · no reinstallInferse is reader-supported. When you buy through links on our site, we may earn an affiliate commission. As an Amazon Associate I earn from qualifying purchases. Learn more
There is no single application-monitoring tool that is best for every microservices system. Prometheus fits teams that mainly need dependable metrics and alerting; OpenTelemetry supplies portable instrumentation rather than a storage backend; Grafana Cloud packages a managed, Prometheus-compatible observability path; Datadog emphasizes turnkey tracing, service maps and integrations; and New Relic bundles broad telemetry under a usage-based model. Paying makes sense when managed scale, cross-signal correlation, support or faster diagnosis outweighs the cost of running an observability stack yourself.
The practical choice starts with the failure you need to explain. Saturation, error rate, latency and capacity can often be handled with metrics. A request that crosses many services requires complete trace propagation and useful dependency views. Teams with scattered logs, traces and deployment data may value a unified commercial platform, while a platform group with strong observability skills may prefer composable open-source components.
General shopping ads
At a glance
These products are listed alphabetically, not ranked. Prices and plan details were checked in November 2026; usage-based allowances and vendor pricing can change.
Recommended Free Tools
| Name | Best for | Key spec | Free plan / price | Platforms | Checked |
|---|---|---|---|---|---|
| Datadog | Turnkey tracing and dependency visibility | Distributed tracing, automatic service maps, deployment tracking and correlated telemetry | APM starts at $31 per host/month on annual pricing | Managed cloud; Kubernetes Explorer | November 2026 |
| Grafana Cloud | Managed Prometheus/Grafana workflows | Correlated metrics, logs and events with OpenTelemetry-native workflows | Free tier; usage-based scaling | Cloud and Kubernetes | November 2026 |
| New Relic | Broad telemetry with usage pricing | APM, infrastructure, logs, real-user monitoring and Kubernetes capabilities | 100 GB ingest/month free; $0.35/GB beyond (2024 fact sheet) | Cloud, Kubernetes and OpenTelemetry integrations | November 2026 |
| OpenTelemetry | Portable, vendor-neutral instrumentation | APIs, SDKs, automatic instrumentation, Collector and OTLP for traces, metrics and logs | Open source; no hosted backend or license fee | Multi-language applications and Kubernetes components | November 2026 |
| Prometheus | Metrics, recording rules and alerting | Labelled time series, pull-based scraping, rule evaluation and Alertmanager | Open source; self-hosted infrastructure costs | Dynamic service-oriented systems and Kubernetes via exporters | November 2026 |
Prices checked November 2026.
What makes microservices monitoring different?
Microservices multiply failure paths. One user request can traverse gateways, APIs, queues, databases and caches owned by different teams. A host-level CPU graph may show that something is wrong without showing which span, deployment or downstream dependency caused the delay.
Shopping ad
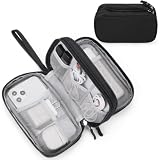
- Dimensions: 7.5" x 4.3" x 2.2". Compact size and lightweight make it easy to carry and put into your backpack, handbags or laptop bag without taking much space. Suitable for family use and daily organization. Note: Small mesh pockets are ideal for charging cords no longer than 3ft; longer cables (over 3ft) fit better in the larger compartments
- Quality Material: This electronic organizer travel case made of high quality durable waterproof oxford and soft sponge inside to secure your gadgets in place and deliver a quick access whenever you want. Water-resistant fabric protects your gear from unexpected splashes, keeping all your electronic essentials safe and secure
- Double Layers Design: This tech pouch features a double-layer interior design with 8 compartments, including multiple see-through mesh pockets and ample space to store your cords, cables, USB drives, cellphone, charger, mouse, flash drive and more, keeping all accessories neatly organized and tangle-free
- Practical and Convenient: Comes with a comfortable hand strap for easy carrying; You may carry it in your hand when heading out. Durable and smooth zipper closure keeps your favorite device securely, convenient for you to have quick access to the items inside the case
- Portable and Lightweight: The small size and lightweight design durable cable organizer pouch is a perfect choice when going on holiday, business trip, travel, office. Enjoy hassle-free travel without wasting time on tangled accessories. Great gift for yourself also a nice share with families and friends. (No include cords, electronic accessories)
Use four questions to define the requirement:
- Which signals are required? Decide whether metrics, logs, traces, profiles, synthetics, real-user monitoring or business events are necessary. Adding every signal increases storage, query and governance work.
- Can a request be followed end to end? Verify trace-context propagation through synchronous calls and asynchronous messaging. Check that database and cache spans contain enough detail to explain latency.
- How much Kubernetes context is needed? Teams may need cluster, node, pod, container, workload, network, controller-health and cost views, not just application charts.
- Who will operate the system? A hosted service shifts upgrades, storage scaling, backups and part of the security burden to the provider. A self-managed stack gives more control over data location and versions but leaves reliability and maintenance with your team.
How do metrics, traces and logs fit together?
Metrics are efficient for alerting on traffic, errors, latency and saturation. Traces explain one transaction’s path and where time or errors accumulate. Logs provide event detail, while deployment metadata connects a behavior change to a release. The strongest workflow links these signals with shared service, environment, version and trace identifiers.
OpenTelemetry can generate and route all three signals, but it is not the place where they are stored or queried. Prometheus stores numeric time series and evaluates alerts; a tracing or log backend is still required for spans and log records. Managed platforms combine more of these functions, but they introduce subscription meters and, potentially, proprietary features.
1. Datadog: who it is for
Datadog suits organizations that want a managed service to discover relationships across many languages, clouds, databases, queues and deployment systems. Its APM documentation describes end-to-end distributed tracing, automatic service discovery and dependency mapping, deployment tracking, a software catalog for ownership, and correlation among traces, metrics, logs, processes and network data. Its Kubernetes Explorer adds Kubernetes-focused telemetry. See the Datadog APM pricing page for the cited rate.
Do these 3 things before closing this tab:
1Clear out junk files and repair common Windows errors2Fix the driver behind crashes, sound loss and screen glitches3Repair Windows errors before they cause bigger problemsPlans and cost
The cited APM price starts at $31 per host per month on an annual pricing basis. Datadog defines billable APM hosts as hosts actively generating submitted traces. Data-stream monitoring, continuous profiling and other capabilities have separate meters or tiers, so estimate costs using peak instrumented hosts, trace-sampling choices, indexed spans, log volume and add-ons. The pricing information used here does not establish a free plan or its limits; budget from the paid meter and confirm any current trial directly with the vendor.
When it fits
Choose this route when reducing the number of systems operators must join during an incident is more important than minimizing license spend. Automatic maps and deployment tracking can shorten the path from an alert to an affected dependency or recent release. It is less compelling when a small service estate already has mature Prometheus and OpenTelemetry practices and would rarely use the broader integration catalog.
Shopping ad

- 【UPGRADED LAPTOP CLEANING KIT 】 The macbook cleaning kit computer screen cleaner comes with a number of accessories including a retractable large brush, polishing cleaning cloth X 2, keycap puller, metal pen tip, flocking sponge, thin soft brush, soft plastic lens cleaning pen, 5 replacing cloth, large cleaning microfiber cloth. You deserve the comprehensive computer cleaning kit keyboard vacuum at a low cost
- 【PROFESSIONAL KEYBOARD CLEANING KIT】 The laptop screen cleaner keyboard cleaner can pull out the keycaps of gaming keyboards and mechanical keyboards. A retractable keyboard brush works on laptops and keyboards, while the mini high-density brush is great for deep cleaning between keys for cleaning between flatter keys on a laptop, the metal pin tip gently removes any stains. This electronic cleaning kit macbook cleaner totally meets professional cleaning needs
- 【OFFICE DESK ACCESSORIES】This keyboard cleaner kit is easy to use and can clean your keyboard and electronic screen with just one swipe. Wiping with the 2mm thicken widen polishing cleaning cloth designed at a right angle for better fitting screen corners of computers with our recyclable cleaning spray, The laptop cleaner kit for macbook effectively absorbs stubborn stains, leaves no discoloration, no streaks, and no fiber shedding on the screens
- 【MULTIFUNCTIONAL TOOLS 】Mini soft brush and soft plastic lens cleaning pen are specially designed for DSLR camera screen, lens, and other delicate surfaces. 5 more cleaning cloths of it supplied for replacement. The flocking sponge is an excellent tool for cleaning earbuds charging cases, And the earbud cleaning kit is ideal. This electronics for college students is equivalent to 10 other electronic cleaning kit
- 【PORTABLE DESIGN & CLEANER TOOL】 The office supplies is compact in design, easy to carry, and you can easily take it anywhere. It's convenient to keep one in a drawer, one in your car, or in your bag and dorm. It is easy to use and can clean your keyboard and electronic screen with just one swipe. Is the college essentials cleaning tool for your friends, family, colleagues and students
2. Grafana Cloud: who it is for
Grafana Cloud is suited to teams familiar with Prometheus metrics, Grafana dashboards, Loki logs, Tempo traces and OpenTelemetry that want those components managed. Its Kubernetes Monitoring offering describes correlated metrics with logs and events, resource visualizations, efficiency comparisons, cost-management integration and an OpenTelemetry-native experience. Details are on Grafana Cloud’s Kubernetes Monitoring page.
Plans and cost
The service advertises a free tier and usage-based scaling. The free allowance is a starting budget, not a promise that a large production estate will remain free. Model active series, log and trace volume, retention and high-cardinality labels before rollout. A managed service removes much of the work of provisioning storage, upgrading components, scaling collectors and securing the control plane; the trade-off is recurring usage cost and less direct control than self-hosting.
What’s actually slowing this PC down?
Pick the symptom - the matching free tool is one click away.
When it fits
This path works well when engineers already query Prometheus-style data and want one place to correlate Kubernetes events, logs and traces without building every backend. It also provides a gradual route from self-managed components to hosted operations. Teams with strict data-location requirements or unusual retention policies should compare the hosted controls with a self-managed deployment before moving production data.
3. New Relic: who it is for
New Relic fits teams seeking broad observability capabilities under a usage-oriented commercial model rather than a strictly per-host license. Its material describes APM, infrastructure monitoring, logs, real-user monitoring, Kubernetes monitoring and OpenTelemetry integration, with more than 30 capabilities in the cited platform overview. The company fact sheet supplies the following allowance and rate.
Plans and cost
The 2024 fact sheet lists 100 GB of free data ingest per month and $0.35 per GB ingested beyond that amount. It also describes unlimited hosts and CPUs under that model. Because those figures come from a 2024 document, verify the current rate card, retention, query limits, free allowance and overage terms before signing. Usage pricing makes telemetry volume the central budgeting variable: high-volume traces and logs can change the economics quickly even when host counts stay flat.
Shopping ad

- Compatible Space: This electronics organizer bag features 2 zippered mesh pockets fits phones, standard power banks, 4 elastic loop pouches for small items, 2 elastic loop pouches for wireless headphones and small chargers. Elastic loops for phone charging cable. And specific slots for SD cards. Please check the size to ensure it meets your needs
- Lightweight Travel Accessories: The size of the electronic organizer travel case is 10.6" L x 7.5" W x 1.2" H, Compact but substantial size fits your intended bag or space. Suitable for traveling use and daily organization
- Keep Everything Organized: This compact travel organizer features dedicated compartments for your phone charger, cables, and tech accessories, keeping them tangle-free and ready to go. You can find travel accessories quickly, no chasing cords in your pack anymore
- Durable Travel Essentials: Features double zippers for easy access, elastic loops with non-slip grips for daily protection. Organizer for office use and traveling, (Not including cords, electronic accessories). It can serve as a travel checklist. Before you leave a place, just open the case and check if everything is there, preventing you from leaving things behind
- Versatile Use: Its practicality and convenience make it a travel essential bag. It is suitable for a weekend trip, business trip, and travel. This organizer pouch is suitable for office, business, daily use and can be given as a gift for friends, family, or men, for birthdays, Valentine's Day, Christmas Day, Father's Day
When it fits
New Relic is a candidate for a small team that wants a meaningful ingest allowance while it establishes coverage, or for a larger organization that needs APM, infrastructure, logs and user-facing monitoring in one platform. Before committing, forecast a normal week and a peak period, and include retention and indexing behavior rather than comparing only the headline free allowance.
4. OpenTelemetry: who it is for
OpenTelemetry is for teams that want one instrumentation layer they can route to different backends. The project defines APIs, SDKs, semantic conventions, automatic instrumentation, a Collector, Kubernetes components and the OTLP protocol for traces, metrics and logs. Its documentation is explicit that OpenTelemetry is not an observability backend.
Plans and cost
OpenTelemetry is open source and has no hosted plan or license charge in the framework itself. You still pay for the compute, storage, network, retention and operations of whichever backend receives the data. Because instrumentation is portable, you can send a controlled sample to multiple systems during an evaluation instead of rewriting every service for each vendor.
When it fits
Use it when avoiding lock-in, owning generated telemetry and keeping consistent APIs across languages are priorities. Validate portability rather than assuming it: test trace context through asynchronous messaging, database and cache span quality, exemplar links between metrics and traces, supported sampling modes and preservation of the attributes needed for debugging. Vendors differ in supported signals, semantic conventions and Collector distributions, so an OpenTelemetry label alone does not guarantee identical behavior everywhere.
5. Prometheus: who it is for
Prometheus suits platform teams that need dependable numeric monitoring and alerting for dynamic service-oriented systems. It stores timestamped time series with key-value labels, scrapes instrumented jobs, evaluates recording and alerting rules and exposes data to Grafana or other API clients. The ecosystem includes client libraries, exporters, Pushgateway and Alertmanager. The official Prometheus overview describes its systems-monitoring role.
The Tool Desk
Outbyte Driver Updater FREEScan for outdated or missing drivers - takes under a minuteDriver Scan →Outbyte PC Repair FREERepair Windows errors before they cause bigger problemsFix Now →Shopping ad

- Universal fit: ColorCoral cleaning gel, simple and convenient cleaning kits for PC/laptop keyboard and other rugged surface, such as the car vent, camera, printer, telephone, calculator, Instrument, speaker, air conditioner, TV and other appliances
- Safe cleaning gel: The keyboard cleaner gel is made from natural gel, no sticky to hands, smells sweet with lemon fragrance, no stimulation to skin
- Easy dust cleaning: Make sure your hands are dry and clean, knead the cleaning gel into a ball, press the cleaning gel slowly into the keyboard, car vent and rugged surface till the cleaning gel could touch the bottom and then pull out, the dust would be carried away with the cleaning gel
- Reusable: The keyboard cleaning gel could be used repeatedly till the color turn to dark or it become sticky, then you have to replace the cleaning gel with a new one. After cleaning, please stock the cleaning gel in cool place. (Note: Don’t wash the gel in water.)
- In the package: 1 can of universal cleaning gel, we provide the cleaning gel with brand new, if you find the package broken, the cleaning gel dirty, or any other quality issues, please email us through message, we provide you new one soon
Plans and cost
Prometheus is open source, so there is no software license fee for a self-managed server. The real costs are the machines, persistent storage, backups, upgrades, high-availability design and staff time. A standalone server can remain available during failures without depending on remote storage, which is useful when the monitoring system itself must diagnose an outage.
When it fits
Choose it when saturation, error rate, latency, capacity and service-level indicators are the immediate questions and the team can operate the stack. Its dimensional model lets queries group by service, namespace, route, status class or cluster. Prometheus is not a complete application-monitoring answer: it does not provide rich request spans, log search or user journeys by itself, and its documentation cautions against using sampled collection for 100-percent-accurate per-request billing. Add OpenTelemetry, a tracing backend, log storage or a managed layer when those capabilities are required.
How should you evaluate candidates safely?
A short, representative evaluation reveals more than a feature checklist. Keep the existing metrics path while testing alternatives so an experiment does not remove your baseline alerts.
- Select representative journeys. Include one synchronous request chain and one asynchronous workflow that crosses several services.
- Define observable outcomes. Set target indicators for latency, errors, traffic and saturation, plus detection time, diagnosis time, alert precision and trace completeness.
- Instrument consistently. Use OpenTelemetry where practical, standardize resource attributes and trace propagation, and document service ownership and deployment identifiers.
- Route the same sample. Send equivalent telemetry to candidate backends. Compare service-map accuracy, query latency, dashboard usefulness and operator effort rather than screenshots.
- Exercise a controlled change. Introduce a deployment that intentionally changes latency or error behavior. The system should connect the regression to the release and affected dependency.
- Model cost and limits. Review active-series counts, label cardinality, indexed spans, ingest volume, retention, query limits, host counts, users and self-hosted compute and storage during normal and peak periods.
- Plan migration. Move dashboards and alert rules in service groups, keep exports and rollback procedures, and retain the original alerts until the new path has demonstrated value.
What are the most common microservices-monitoring mistakes?
- Buying a backend before fixing propagation. Missing trace context, inconsistent resource attributes and unstable labels make every backend look incomplete.
- Treating OpenTelemetry as a storage product. It standardizes generation and transport; you still need systems that retain and query the data.
- Ignoring cardinality. Unbounded route, user or request identifiers can inflate active series and query cost. Establish label rules before production rollout.
- Comparing list prices only. Include sampled and indexed spans, log ingestion, retention, add-on meters, annual-versus-monthly terms, self-hosted storage and operator time.
- Monitoring only infrastructure. Node and pod health cannot explain a slow database span, queue delay or failed downstream call without application-level instrumentation.
- Skipping asynchronous tests. A tool may trace HTTP perfectly while losing context across a queue or background worker. Make that path part of acceptance criteria.
How we chose the shortlist
The shortlist covers the distinct architectural roles a microservices team may need: a metrics and alerting backend, a vendor-neutral instrumentation layer, a managed open-source-oriented service and two commercial platforms with broader correlation. Selection criteria were signal coverage, cross-service diagnosis, Kubernetes depth, OpenTelemetry fidelity, scale and economics, operational burden and developer workflow. The products remain in alphabetical order rather than a ranking.
Which tool should your team start with?
Start with Prometheus when metrics and alerting are the urgent gap and you can run the infrastructure. Add OpenTelemetry early if you want instrumentation portability or expect to compare backends. Consider Grafana Cloud when you want managed operations around a Prometheus/Grafana workflow. Consider Datadog when broad integrations, automatic dependency maps and deployment correlation justify host-based pricing. Consider New Relic when a usage-priced platform and a large ingest allowance match your telemetry profile.
Shopping ad

- Award-Winning Compact Design & EDC-Ready Gift Choice: Weighing only 0.09 lb and sized like a credit card, this compact laser measure is designed for everyday carry. It slips easily into a pocket, tool pouch, or bag, and can attach to a keychain for quick access wherever you go. Its minimalist design, premium tactile finish, and practical one-button measuring make it a useful EDC gadget for DIYers, real estate agents, homeowners, and tech enthusiasts. A thoughtful gift for men on any occasion
- One-Button Easy Measuring, Simple to Use: Designed with simple one-button operation, this compact laser tape measure makes quick measuring easy without complicated controls. Just press to measure room dimensions, furniture spacing, window height, wall décor placement, and everyday distances around the home. Ideal for users who want a smart, pocket-size measuring tool that fits naturally into an everyday carry (EDC) setup and feels intuitive, modern, and easy to use
- Fast & Accurate Indoor Measurements with Class 2 Laser: Measure distances from 0.16 ft to 98 ft with up to ±1/16 in / ±2 mm accuracy. With quick measurement response in about 0.2 seconds, HOTO helps you check spaces efficiently for home renovation, furniture layout, moving, decorating, craft projects, and DIY planning. Built with a Class 2 laser for everyday indoor measuring; use as directed and avoid direct eye exposure
- Low-Power OLED Display & USB-C Rechargeable Convenience: The low-power OLED display provides clear indoor readings while helping reduce battery drain. With USB-C rechargeable design, auto shut-off, and up to 1000 measurements per charge, this digital laser measure is built for repeated daily use without frequent battery replacement. Compact enough to keep in a drawer, toolbox, bag, or pocket
- Useful for Home, Work & Everyday Projects: From home renovation and furniture measuring to room planning, real estate checks, interior design, and light construction projects, this pocket-size laser distance measure is made for practical everyday use. Compact enough to keep in a drawer, toolbox, bag, or pocket, it is a stylish measuring tool that feels just as giftable as it is useful
In many environments the answer is a combination rather than a replacement: OpenTelemetry for instrumentation, Prometheus for a durable metrics baseline, and a tracing, log or managed platform for the signals that metrics cannot explain. Decide only after measuring diagnosis quality and total operating cost on representative traffic.
Frequently Asked Questions
Can I keep Prometheus while adding a commercial APM platform?
Yes. Prometheus can remain the baseline for recording rules and alerts while OpenTelemetry or a vendor agent sends traces and additional signals elsewhere. Keep metric names, ownership metadata and alert routing documented so a backend change does not silently remove coverage.
Is OpenTelemetry enough to monitor a production service by itself?
No. It creates and transports telemetry but does not store, index or visualize it. Pair the Collector and SDKs with a metrics, tracing and log backend, whether self-hosted or managed.
How much tracing should a microservices system retain?
There is no universal percentage: retain enough complete traces to diagnose representative journeys and rare failures, then control cost with documented sampling and retention policies. Evaluate normal and peak traffic, indexed spans and query limits before setting production defaults.
Do Kubernetes teams need a separate monitoring product?
Not necessarily. Prometheus exporters, OpenTelemetry components and managed Kubernetes offerings can cover cluster and workload signals, but verify that the chosen setup exposes the node, pod, controller, network and cost context your operators actually use.
More shopping ads
Product prices and availability are accurate as of the date/time indicated and are subject to change. Any price and availability information displayed on Amazon at the time of purchase will apply.