LLDB: Free LLVM Debugger
lldb.llvm.org · checked 30 Sept 2026
Free LLVM debugger for C-family programs on desktop and mobile systems.
How it plugs in
Signal on Debuggers6.7#1 of 27
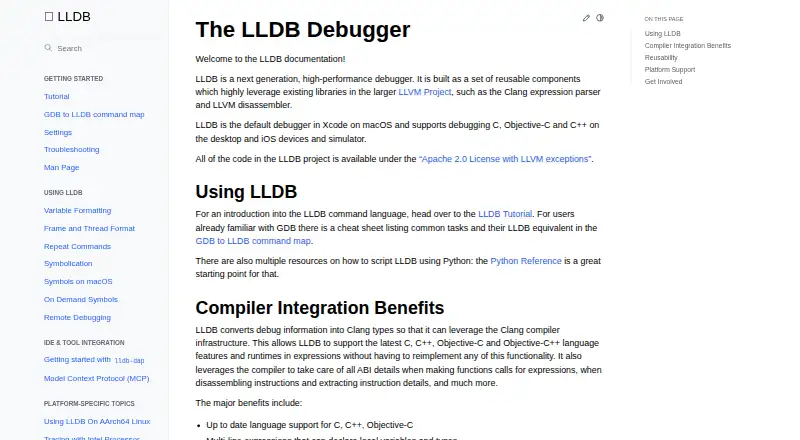
Built from LLVM components, LLDB debugs C, C++, Objective-C and Objective-C++ programs. It can set breakpoints and watchpoints, control processes, inspect core dumps and debug remotely. macOS, Linux, Windows and other listed targets are supported, and Xcode uses LLDB by default. C++ and Python APIs plus lldb-dap connect it to custom tools and editors.
Review
In a line
LLDB is an open-source debugger assembled from reusable LLVM libraries. It lets developers examine and control programs written in C, C++, Objective-C and Objective-C++.
The project lists desktop and mobile targets such as macOS, iOS, tvOS, watchOS, Linux, Android, FreeBSD, NetBSD and Windows.
What it does
LLDB can start a program, attach to an existing process, and stop execution through breakpoints or watchpoints. Conditional and exception breakpoints, memory inspection, core-dump analysis and disassembly are also available.
Using Clang infrastructure, its evaluator handles current C, C++, Objective-C and Objective-C++ constructs. Where supported, expressions may span multiple lines and run through just-in-time evaluation.
Documentation covers remote sessions involving Linux, Windows, Android and iOS.
How it connects
A shared library exposes LLDB's public object-oriented C++ interface, and Python bindings are available for scripts. Those interfaces can be used for symbolication, disassembly, and examining object or symbol files.
Through the Debug Adapter Protocol, lldb-dap makes LLDB available to compatible editors and IDEs such as Visual Studio Code, Emacs, vim and neovim. Its documented requests cover function, conditional, data and instruction breakpoints, memory reads and writes, and disassembly.
The project code uses the Apache 2.0 License with LLVM exceptions. You can obtain lldb-dap from a toolchain, LLVM release package or system package manager, or build it from source.
Good fit
Developers working on C-family software for desktops or Apple devices and simulators may find LLDB suitable; macOS Xcode uses it as its default debugger.
The available C++ and Python interfaces also suit teams building scripts or surrounding tools rather than relying only on an interactive session.
Watch for
Windows work remains active. Basic functionality is expected to operate, whereas ARM and AArch64 support is characterized as more experimental.
lldb-dap does not document step-back, setting a variable, goto-target or terminate requests. For security, LLDB also warns that it does not source a .lldbinit file from the current directory by default.
Check the target platform, editor and required debugging requests before adopting it.
Pricing
LLDB has a free plan and no free trial. Its project code is released under the Apache 2.0 License with LLVM exceptions.
Verdict
Choose LLDB when you need a cost-free debugger for C-family code, particularly with Xcode, Apple targets or other LLVM-supported systems. Scripting interfaces and an editor adapter extend its use beyond one desktop debugger.
Windows users depending on ARM or AArch64 should review the current support level. Teams needing time travel or lldb-dap requests that are not documented should verify another tool first.
Our take
LLDB fits developers using C, C++, Objective-C or Objective-C++ who want a free debugger across many targets. Xcode includes it as the standard debugger, while lldb-dap connects compatible editors. Its C++ and Python interfaces support custom tooling and inspection. Review Windows architecture support, and check alternatives if step-back, variable-setting, goto-target or terminate requests are essential.
- Open source under the Apache 2.0 License with LLVM exceptions at no cost
- Debugs C, C++, Objective-C and Objective-C++ programs
- Works with Xcode and editors that support lldb-dap
- Provides C++ and Python interfaces for scripts and tooling
- Includes remote sessions and core-dump debugging
- Windows work remains under active development
- Windows ARM and AArch64 support is characterized as more experimental
- lldb-dap does not document step-back, variable-setting, goto-target or terminate requests
- Time-travel debugging is not offered
- Pick it ifC-family debugging on Apple, Linux, Android and other desktop targets; Teams building around C++ APIs or Python debugger scripts; Xcode users seeking its built-in debugger
- Skip it ifYou depend on mature Windows ARM or AArch64 support; You need time travel or undocumented lldb-dap requests; Your editor lacks Debug Adapter Protocol support
Pricing
LLDB costs nothing: it has a free plan and no free trial, and the code is open source under the Apache 2.0 License with LLVM exceptions.
- LLDBOpen source debuggerFree
As lldb.llvm.org lists them, checked 30 Sept 2026.
Questions
Is LLDB available without charge?
Yes. LLDB has a free plan and no free trial.
Which programming languages can it debug?
Its supported language set includes C, C++, Objective-C and Objective-C++.
Which systems and devices are listed as targets?
The listed targets include macOS, iOS, tvOS, watchOS, Linux, Android, FreeBSD, NetBSD and Windows.
Can LLDB be used inside Xcode?
Yes. Xcode on macOS uses LLDB as its default debugger.
Can an editor connect through lldb-dap?
Yes. lldb-dap uses the Debug Adapter Protocol to connect LLDB with compatible tools such as Visual Studio Code, Emacs, vim and neovim.
Are remote sessions supported?
LLDB documentation describes remote debugging for Linux, Windows, Android and iOS.
What should Windows users know?
Windows support is still being developed; basic operation is expected, while ARM and AArch64 support is more experimental.
Does LLDB expose programming interfaces?
Yes. A shared library provides a public C++ API, and Python bindings support scripting and related inspection work.